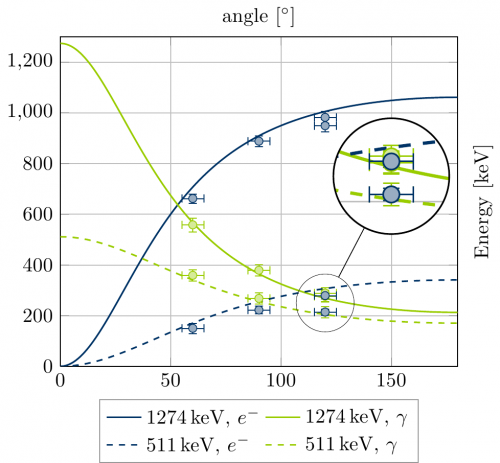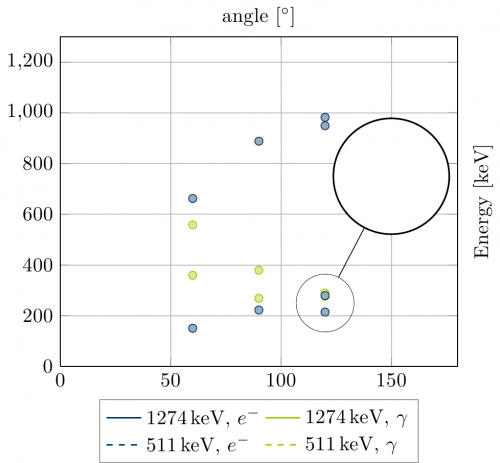
Creating an image like this was my goal – but I didn’t take into account my “you-work-on-sunday-bad-luck”. To keep things simple: don’t try to use the spy module for documents you have to compile with latex. Use pdflatex instead. Otherwise you might get this

For the sake of completeness, here’s the code:
\documentclass[a4paper,10pt]{standalone}
\usepackage[utf8x]{inputenc}
\usepackage{tikz,pgfplots,color,amsmath,amssymb}

\usetikzlibrary{pgfplots.groupplots}

\usetikzlibrary{spy,backgrounds}
\definecolor{fu-blue}{RGB}{0, 51, 102} % blue text
\definecolor{fu-green}{RGB}{153, 204, 0} % green text
\begin{document}
\begin{tikzpicture}[spy using outlines={circle, magnification=2,connect spies}]
\begin{axis}[legend columns=2,legend style={anchor=north,at={(0.5,-.1)},draw=black!40},
xmin=0,xmax=180,ymin=0,ymax=1300,xlabel={angle [$^\circ$]},ylabel={Energy [keV]}, ylabel style={at={(1.2,0.5)}, anchor=north},xlabel style={at={(0.5,1.1)},anchor=south},grid=both,]
\addplot+[line legend,mark=none,draw=fu-blue,thick,domain=0:180,samples=1000] {1274*(1-(1/(1+1274/511*(1-cos(x)))))};
\addlegendentry{1274\,keV, $e^-$}
\addplot+[line legend,mark=none,draw=fu-green,thick,domain=0:180,samples=1000] {1274*((1/(1+1274/511*(1-cos(x)))))};
\addlegendentry{1274\,keV, $\gamma$}

\addplot+[forget plot,line legend,draw=fu-green,mark options={fill=fu-green!40},only marks,mark=*,error bars/.cd,x dir=both, x explicit,y dir=both, y explicit,error bar style={color=fu-green}]  coordinates {
(60, 359) +- (5,23)
(60, 558) +- (5,27)
(90, 268) +- (5,22)
(90, 379) +- (5,23)
(120, 214) +- (5,22)
(120, 276) +- (5,22)
(120, 278) +- (5,22)
(120, 289) +- (5,22)
 };


\addplot+[forget plot,line legend,draw=fu-blue,mark options={fill=fu-blue!40},only marks,mark=*,error bars/.cd,x dir=both, x explicit,y dir=both, y explicit,error bar style={color=fu-blue}]  coordinates {
(60, 150) +- (5,20)
(60, 662) +- (5,18)
(90, 222) +- (5,15)
(90, 888) +- (5,22)
(120, 279) +- (5,12)
(120, 214) +- (5,12)
(120, 949) +- (5,24)
(120, 982) +- (5,23)
 };

\addplot+[line legend,mark=none,draw=fu-blue,dashed,thick,domain=0:180,samples=1000] {511*(1-(1/(1+511/511*(1-cos(x)))))};
\addlegendentry{511\,keV, $e^-$\,\,\,}

\addplot+[line legend,mark=none,draw=fu-green,thick,dashed,domain=0:180,samples=1000] {511*((1/(1+511/511*(1-cos(x)))))};
\addlegendentry{511\,keV, $\gamma$\,\,\,}

\coordinate (spypoint) at (axis cs:120,250);
\coordinate (spyviewer) at (axis cs:150,750);
\spy[width=2cm,height=2cm] on (spypoint) in node [fill=white] at (spyviewer);

\end{axis}
\end{tikzpicture}
\end{document}