Using different programs for diagrams within one single document can be a never ending story of unmatching graphics. For example, matplotlib used a different interpolation method for colormaps than pgfplots. Disregarding alpha components, the following script produces a matching colormap. Just specify the matplotlib colormap name as command line argument […]
Daily archives: August 29, 2013
2 posts
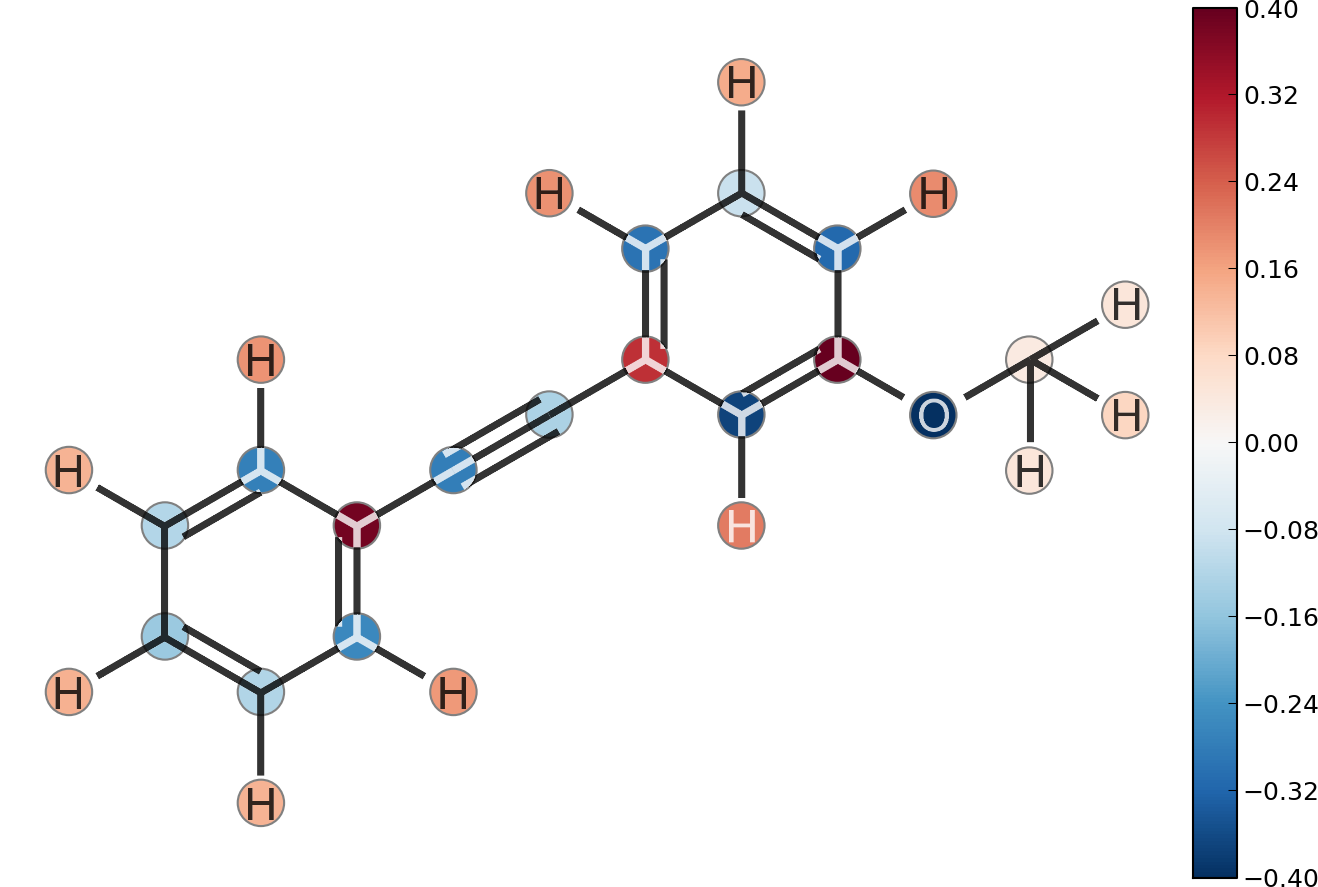
Sometimes chemical structures are not enough to present your data. Instead of adding tables, you can graphically annotate compounds. For example the results of a charge fitting procedure (hence the decimal values for electron charges) can be visualized as follows Here is how to do it: Download the indigo toolkit […]