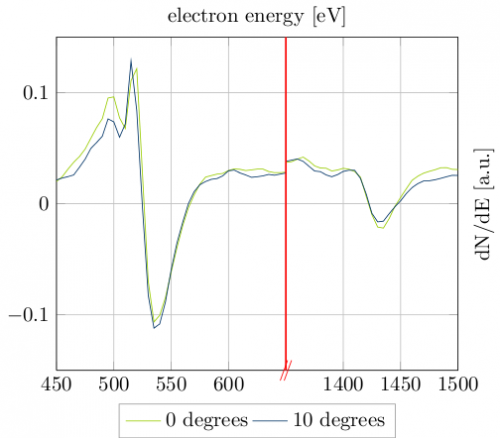
Although pgfplots supports discontinuities, the method described in the manual is only applicable for the zero crossing and is unable to handle data on both sides of the singularity. As I needed this functionality, I came up with this small hack. The code is rather ugly, the result is not. After all, we’re using LaTeX 😉
The main idea is to restrict the input file with the appropriate restrict x to domain twice while shifting the right part of the diagram by a constant offset. The drawback: you have to define the labels by yourself, so please refrain from brain-dead copying.
Now here is the code – it is not minimal, but you will get the idea:
\documentclass[a4paper,10pt]{standalone}
\usepackage[utf8x]{inputenc}
\usepackage{tikz,pgfplots,color,amsmath,amssymb}

\usetikzlibrary{pgfplots.groupplots}

\usetikzlibrary{spy,backgrounds}
\definecolor{fu-blue}{RGB}{0, 51, 102} % blue text
\definecolor{fu-green}{RGB}{153, 204, 0} % green text
\begin{document}
\begin{tikzpicture}
\begin{axis}[legend columns=-1,legend style={anchor=north,at={(0.5,-.1)},draw=black!40},
xmin=450,xmax=800,ymin=-.15,ymax=.15,xlabel={electron energy [eV]},ylabel={dN/dE [a.u.]}, ylabel style={at={(1.2,0.5)}, anchor=north},xlabel style={at={(0.5,1.1)},anchor=south},grid=both,
xticklabels={,450,500,550,600,,1400,1450,1500},
extra x ticks={650},extra x tick style={grid=major, tick label style={xshift=0cm,yshift=.30cm}},extra x tick labels={\color{red}{/\!\!/}}
]
\addplot+[draw=fu-green,mark=none,restrict x to domain=450:650] table[x index=0,y expr=\thisrowno{1}/10000,header=false] {../Daten/AES-04-ungereinigt_vergleich_0};
\addlegendentry{0 degrees};
\addplot+[draw=fu-blue,mark=none,restrict x to domain=450:650] table[x index=0,y expr=\thisrowno{1}/10000,header=false] {../Daten/AES-03-ungereinigt_vergleich_10grad};
\addlegendentry{10 degrees};
\addplot+[draw=fu-green,mark=none,restrict x to domain=650:800] table[x expr=\thisrowno{0}-700,y expr=\thisrowno{1}/10000,header=false] {../Daten/AES-04-ungereinigt_vergleich_0};
\addplot+[draw=fu-blue,mark=none,restrict x to domain=650:800] table[x expr=\thisrowno{0}-700,y expr=\thisrowno{1}/10000,header=false] {../Daten/AES-03-ungereinigt_vergleich_10grad};
\draw [red, thick] (axis cs:650,-.15) -- (axis cs:650,.15);
\end{axis}
\end{tikzpicture}
\end{document}
