Using different programs for diagrams within one single document can be a never ending story of unmatching graphics. For example, matplotlib used a different interpolation method for colormaps than pgfplots. Disregarding alpha components, the following script produces a matching colormap. Just specify the matplotlib colormap name as command line argument […]
pgfplots
5 posts
As usual, a new day in the lab requires new function plots. But now that you have a different data source, you may observe some potential pitfalls with pgfplots.

Today, a colleague of mine came up with this problem Between the two groupplots, there is a additional label [K] which he liked to get rid of. The relevant source part was \begin{groupplot}[ y unit=K ] \nextgroupplot \addplot coordinates { % snip }; \nextgroupplot \addplot coordinates { % snip }; […]
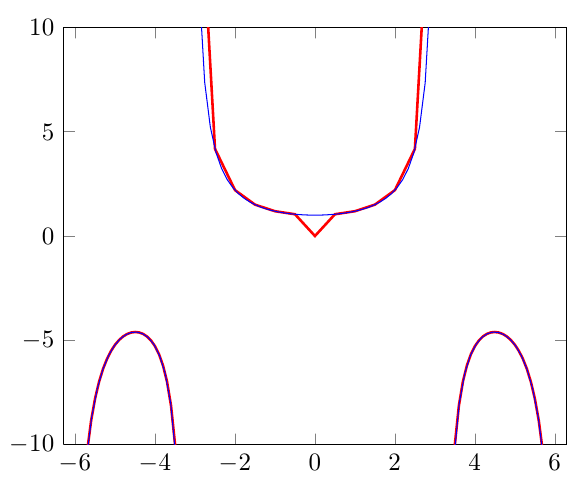
Although pgfplots supports discontinuities, the method described in the manual is only applicable for the zero crossing and is unable to handle data on both sides of the singularity. As I needed this functionality, I came up with this small hack. The code is rather ugly, the result is not. […]
Creating an image like this was my goal – but I didn’t take into account my “you-work-on-sunday-bad-luck”. To keep things simple: don’t try to use the spy module for documents you have to compile with latex. Use pdflatex instead. Otherwise you might get this For the sake of completeness, here’s […]